9 Most Important Facebook Ad Metrics You Need to Know
Thu Huyen
532 views
Table of Contents
In the digital age, Facebook advertising is an important channel for businesses to reach customers. However, many small businesses still run Ads based on emotions, causing the budget to quickly "evaporate". To have an effective campaign, you need to master Facebook advertising indicators (Facebook Ads Metrics) to analyze, optimize and ensure profits.
What are Metrics and their Role in Facebook Advertising?
Metrics are quantitative data used to evaluate the effectiveness of advertising, such as impressions, click-through rate (CTR), cost per action (CPA), or return on investment (ROI). In other words, metrics are the "language of data" that helps marketers see how their ads are performing.
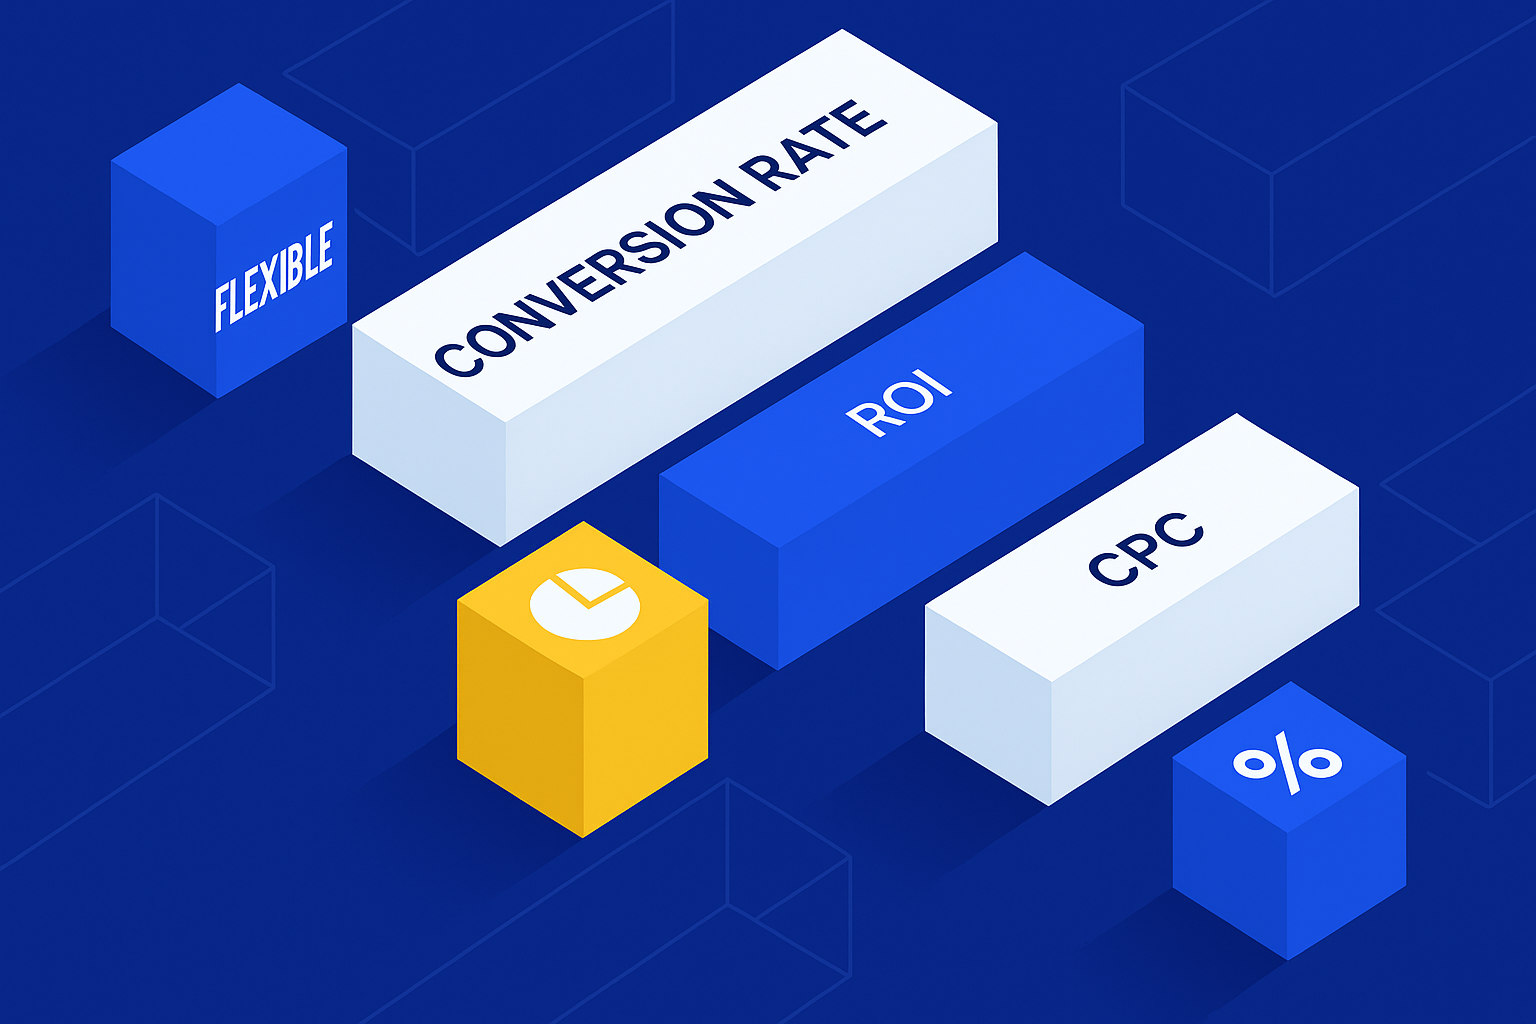
Metrics that help evaluate advertising effectiveness (Source: Instapage)
If we consider Facebook Ads as a "money-printing machine," then metrics are the dashboard, showing the status of the entire machine.
-
Metrics Reflecting advertising effectiveness:
This data tells you whether your campaign is performing well, whether it has achieved its desired reach and conversion goals.
Metrics reveals budget "gaps":
By tracking the data, you can detect ineffective ads early to stop or optimize them in time, avoiding wasted money.
Metrics is the foundation for optimal decisions:
The numbers help marketers know when to increase the budget, try A/B testing, or adjust targeting, instead of relying on intuition.
For example: you run a campaign to sell athletic shoes. The ad has eye-catching visuals and emotionally engaging content, but the CTR is only 0.2% (much lower than the average of 1.5%). Without tracking CTR, you might think the campaign is doing "well." But in reality, this metric indicates that the ad isn't engaging enough or is targeting the wrong audience.
9 most important Facebook Ads metrics
1. Reach
Reach tells you how many unique users have seen the ad. This is a metric that helps you assess the level of brand reach.
- Different from Impressions: Reach is measured by people, Impressions are measured by the number of impressions (the same person can see it multiple times).
- How to read: High Reach indicates that the content is powerful enough to spread; Low reach can be due to a narrow target audience or unappealing creative content.
When reach is low, try expanding your audience or conducting A/B testing of your creative content.
2. Cost per Action (CPA)
CPA shows how much each action (purchase, form submission, registration, etc.) costs.

Cost Per Action Formula
- Formula: Total advertising cost / number of actions achieved.
- Meaning: The lower the CPA, the more effective the advertising.
- Formula: (Number of clicks / Number of impressions) x 100%.
- Meaning: High CTR = engaging content, correct targeting; Low CTR = ad doesn't create enough motivation to click.
- Frequency 2-3: reasonable.
- Frequency 5+: easily causes ad fatigue (viewers get bored, skip, or report).
- Formula: ROI = (Revenue – Costs) / Costs.
- ROI > 0: The campaign is profitable. Example: spending 20 million on advertising, earning 35 million → ROI = 75%.
- ROI < 0: Campaign is losing money, needs adjustment or suspension.
- High engagement creates social proof, making others trust the product or brand more.
- Advertising platforms often prioritize organic distribution for highly interactive content, thereby reducing advertising costs.
- Low CPM usually comes with a broad audience, engaging content, and little competition.
- High CPM occurs when the target is narrow, the market has many competitors bidding, or the content is not sufficiently attractive.
- High conversion rate indicates that the ads, landing page, and product are working in sync.
- Low conversion rate may be due to unappealing ads, slow-loading landing pages, overly complex forms, or inconvenient payment processes.
- Cost per Messaging Reply: measures the cost per response in Messenger.
- Cost per Page Like: cost to get another like. page.
- Video Metrics: 10-second views, ThruPlays, Average Watch Time.
- Blocked Messaging Connections: Number of times blocked by users after messaging.
- Define clear goals: Do you need to increase leads, revenue, or brand awareness? Each goal is associated with a different set of metrics.
- Monitor regularly: Don't wait 7–10 days after your campaign starts to check the reports. Facebook Ads are constantly changing, so you need to check them daily.
- A/B Testing: Always compare 2–3 versions of creative, headline, or targeting to find the best option.
- Invest in landing pages: No matter how good the ad is, if the landing page isn't persuasive, you'll still lose money.
- Using advanced tracking tools: Ads Manager is just the basics; combine it with specialized tools (e.g., Keitaro Tracker) to track more than 30 detailed metrics.
- Invest in landing pages: No matter how good the ad is, if the landing page isn't persuasive, you'll still lose money.
If the CPA is too high, review your target audience and ad content. Sometimes just changing the CTA can significantly reduce CPA.
3. Click-Through Rate (CTR)
CTR reflects the percentage of people who click on the ad after seeing it.
The average CTR on Facebook is about 1.5%. If your CTR is below 0.5%, consider rewriting the headline, changing images, or refining your target audience.
4. Cost per Click (CPC)
CPC reflects the average cost per click. This is a familiar metric for evaluating budget allocation efficiency.
A low CPC isn't necessarily good if the CTR is low and conversions are poor. Always look at CPC in relation to ROI.
5. Display Frequency
Facebook calculates the average number of times a person sees an ad.
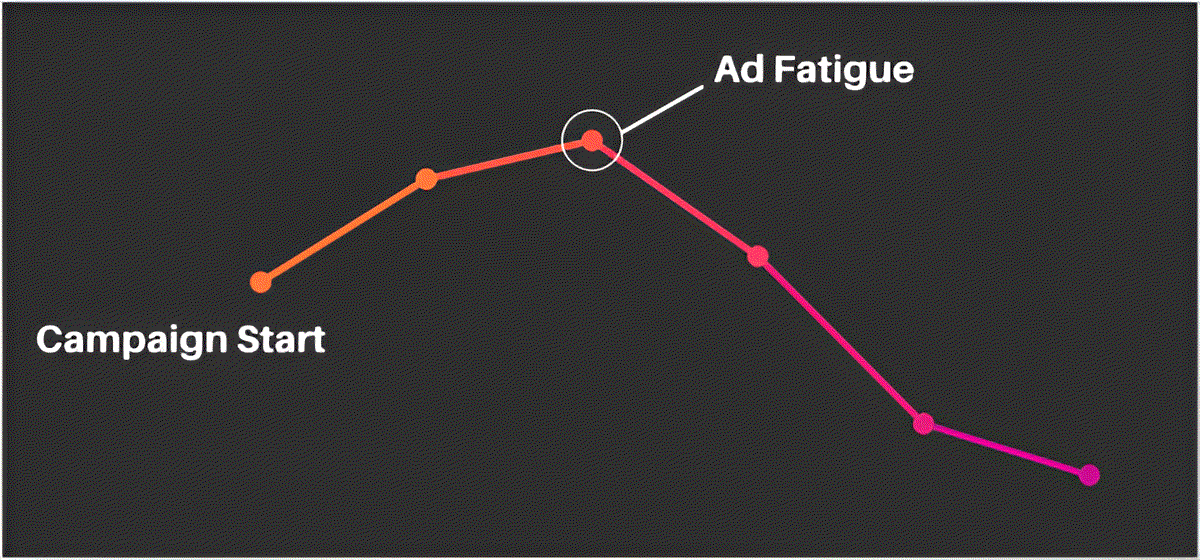
Ad fatigue occurs when content doesn't change (Source: Charlie Lawrance)
6. Return on Investment (ROI)
ROI reflects whether the advertisement is actually profitable or not. This is the core metric for determining business effectiveness, instead of just looking at reach or engagement.
ROI analysis helps businesses avoid falling into the “vanity metrics trap” – numbers that look good but don’t bring real profits.
7. Engagement
Engagement includes actions such as liking, sharing, commenting, clicking, and saving posts. This is a measure showing the level of customer interest and response to the advertisement.

The higher the engagement, the more effective the advertisement. fruit
Example: a summer drink advertisement video that receives thousands of comments asking for prices and sharing experiences will spread quickly without needing too much additional budget.
8. Cost per 1000 Impressions (CPM)
CPM indicates the amount you have to pay for your ad to be displayed 1,000 times. This is an important metric to understand the level of competition and distribution efficiency.
For example, a promotional campaign for a common product may achieve a low CPM, while real estate advertising usually has a high CPM due to fierce competition.
9. Conversions
Conversions are the most important metric, reflecting the final results of advertising: number of orders, number of forms filled out, number of posts Signed.
Example: spending 10 million VND on advertising, receiving 1,000 landing page visits, of which 100 people filled out the registration form → conversion rate 10%. If only 20 people actually make a purchase, you need to optimize customer care and closing the sale.
To improve conversions, you can't just focus on advertising; you need to synchronize the product, landing page experience, and sales process.
Additional metrics that few people pay attention to but are extremely useful
In addition to the 9 core metrics, Facebook also provides many advanced metrics:
These metrics are especially important for businesses running Messenger ads, event ads, or video ads.
How to use metrics to optimize ads?
Metrics are not just dry data; they are the "map" that helps you know if you're going in the right direction or lost. So how to leverage metrics to optimize your advertising?

GTG CRM's Landing Page Templates Collection
Conclusion
Running Facebook ads without understanding metrics is no different No one sets sail without a compass. You'll spend a lot of money without knowing if you're heading in the right direction. Start with the basics (Reach, CTR, CPC, Conversions), then upgrade to more advanced metrics. Combined with regular data monitoring, your advertising effectiveness will definitely improve significantly.
Maybe You Should Read These

Update new consumption trends in Vietnam in the period 2025 - 2030

Revealing business secrets that make startups successful

Gift Sales Schedule for the Year & How to Optimize Revenue with SEO-Standard Landing Page

5 steps to create effective content, attracting tens of thousands of potential customers

The secret to building a SEO-standard Website/Landing Page: A solid foundation for every Digital Marketing campaign